new
Project Dashboards
Powerful New Map & Table Views in Our Project Dashboards!
We're excited to announce the launch of two powerful new features designed to streamline your workflow and empower informed decisions:
Map views and Table views
across all your Project Dashboards!New Map Views!
Imagine having a bird's-eye view of your entire real estate operation. With our newly launched map views across all Project Dashboards, that vision becomes a reality!
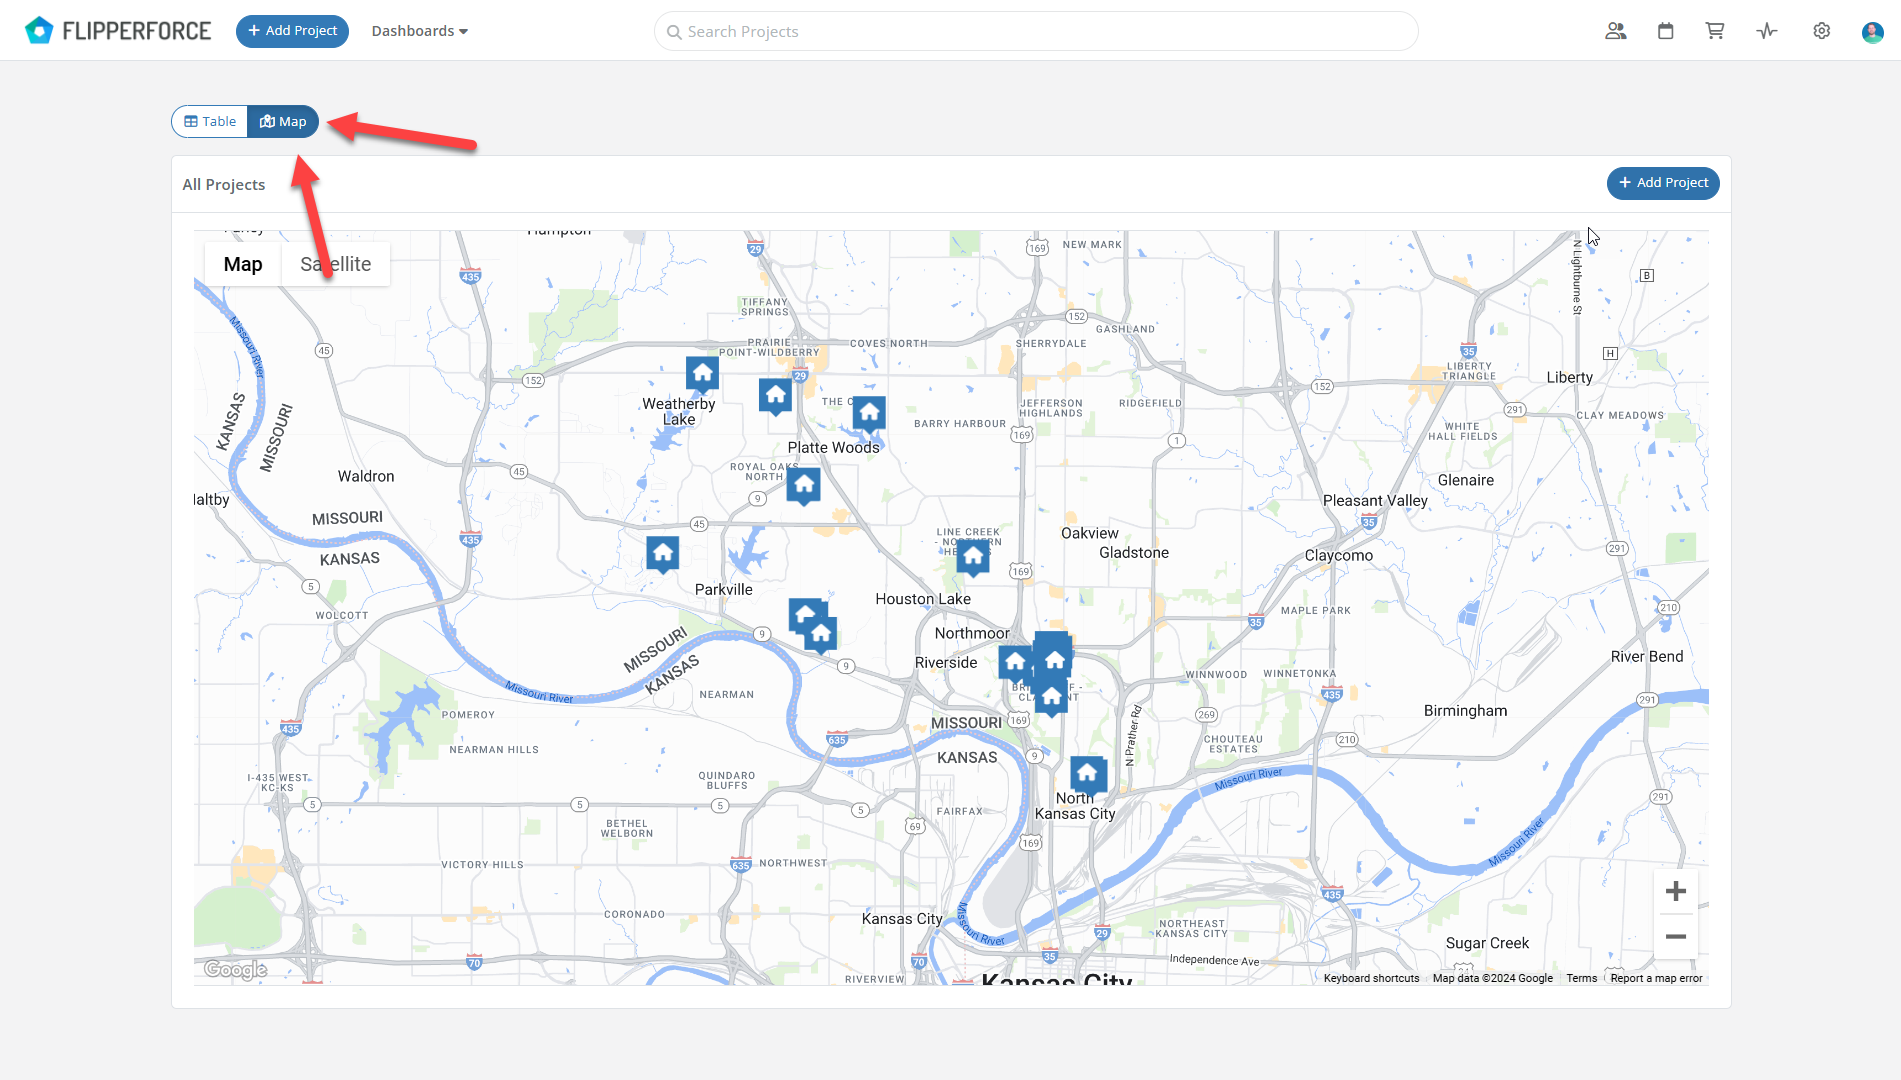
Main Project Dashboard Map View
On our Main Project Dashboard we added a new map view that shows all your projects, including Leads, Active Projects and Completed Flips, plotted on a map. This overall map view will help you Identify areas with high project concentration, helping you strategize future investments and optimize your growing portfolio.
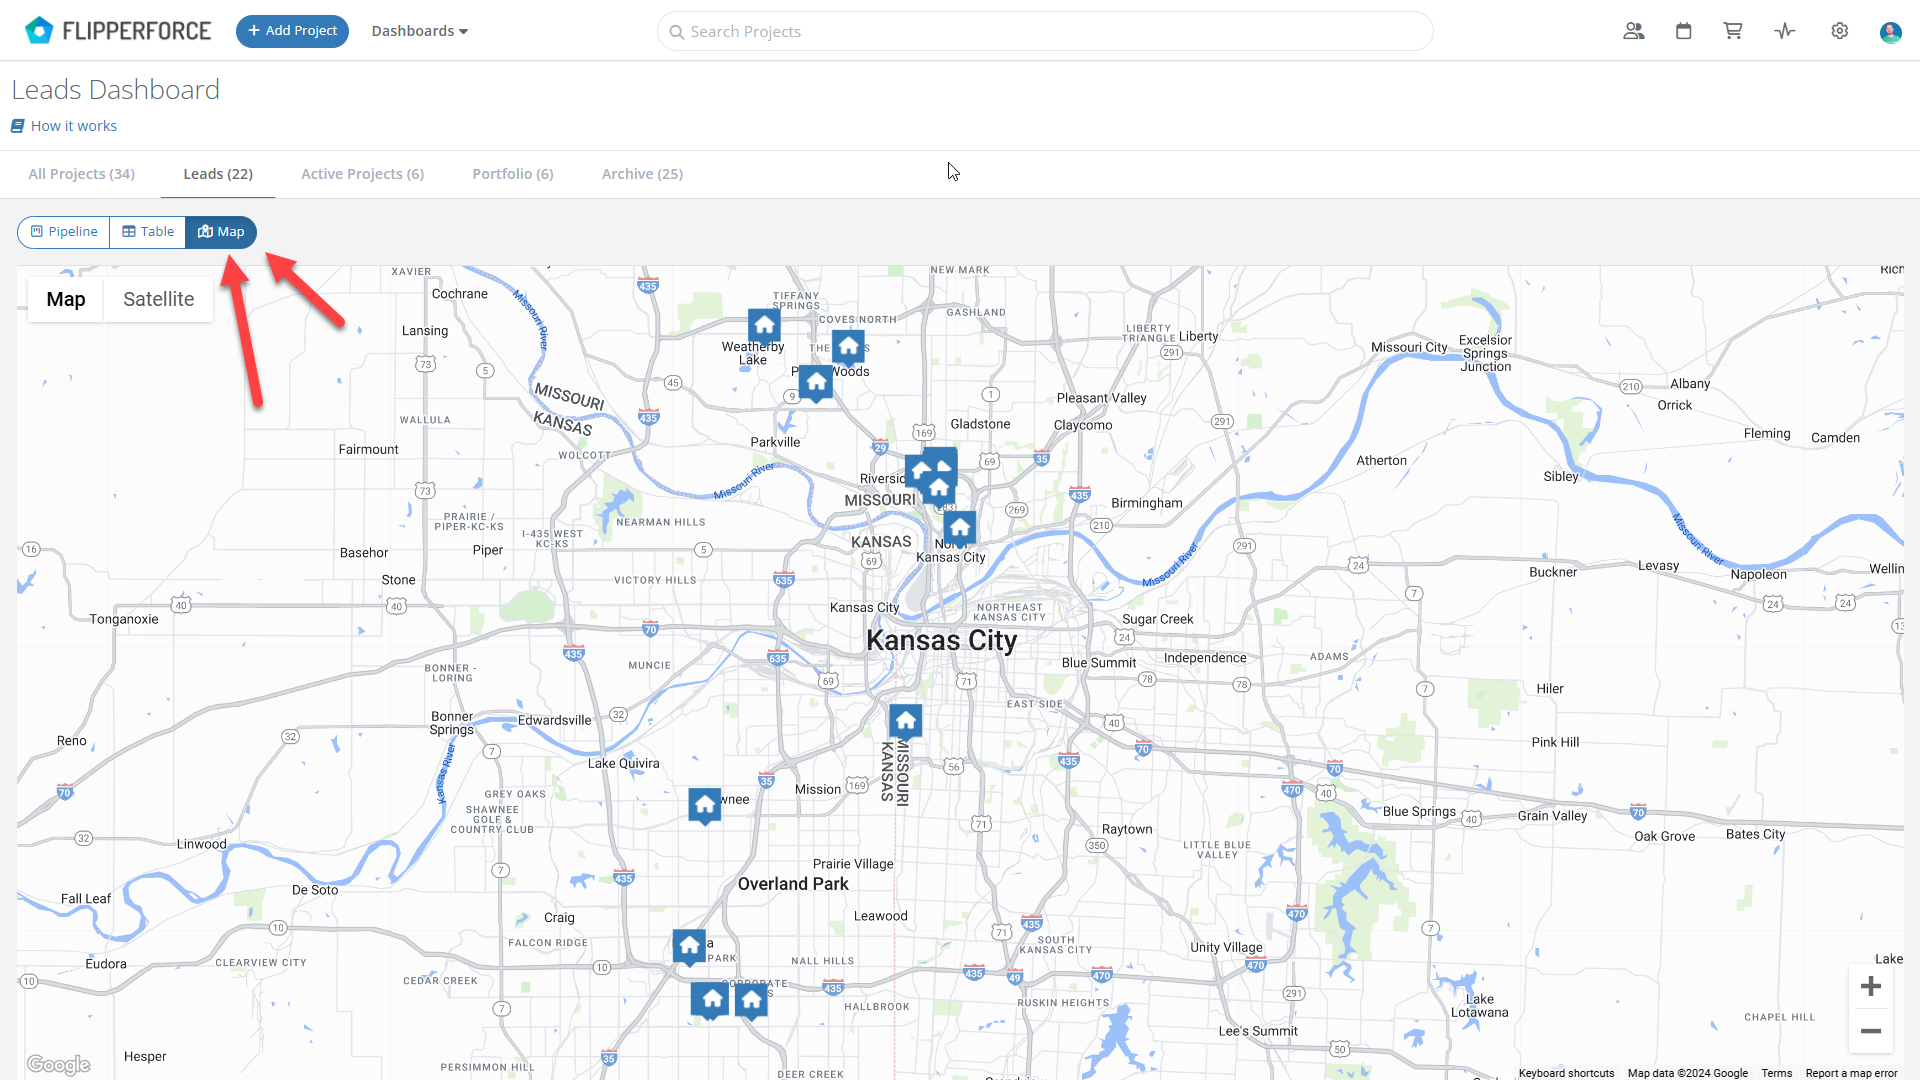
Leads, Active Projects & Portfolio Map Views
Each Project Dashboard (Leads, Active Projects, Portfolio) also now includes a map view alongside the Pipeline & Table view options.
Enhanced Data Insights with Table Views
The Map view provides a high-level picture, but we know you also crave the details, so we added new Table views to all of our Dashboards that provide the most important datapoints for each stage of your projects.
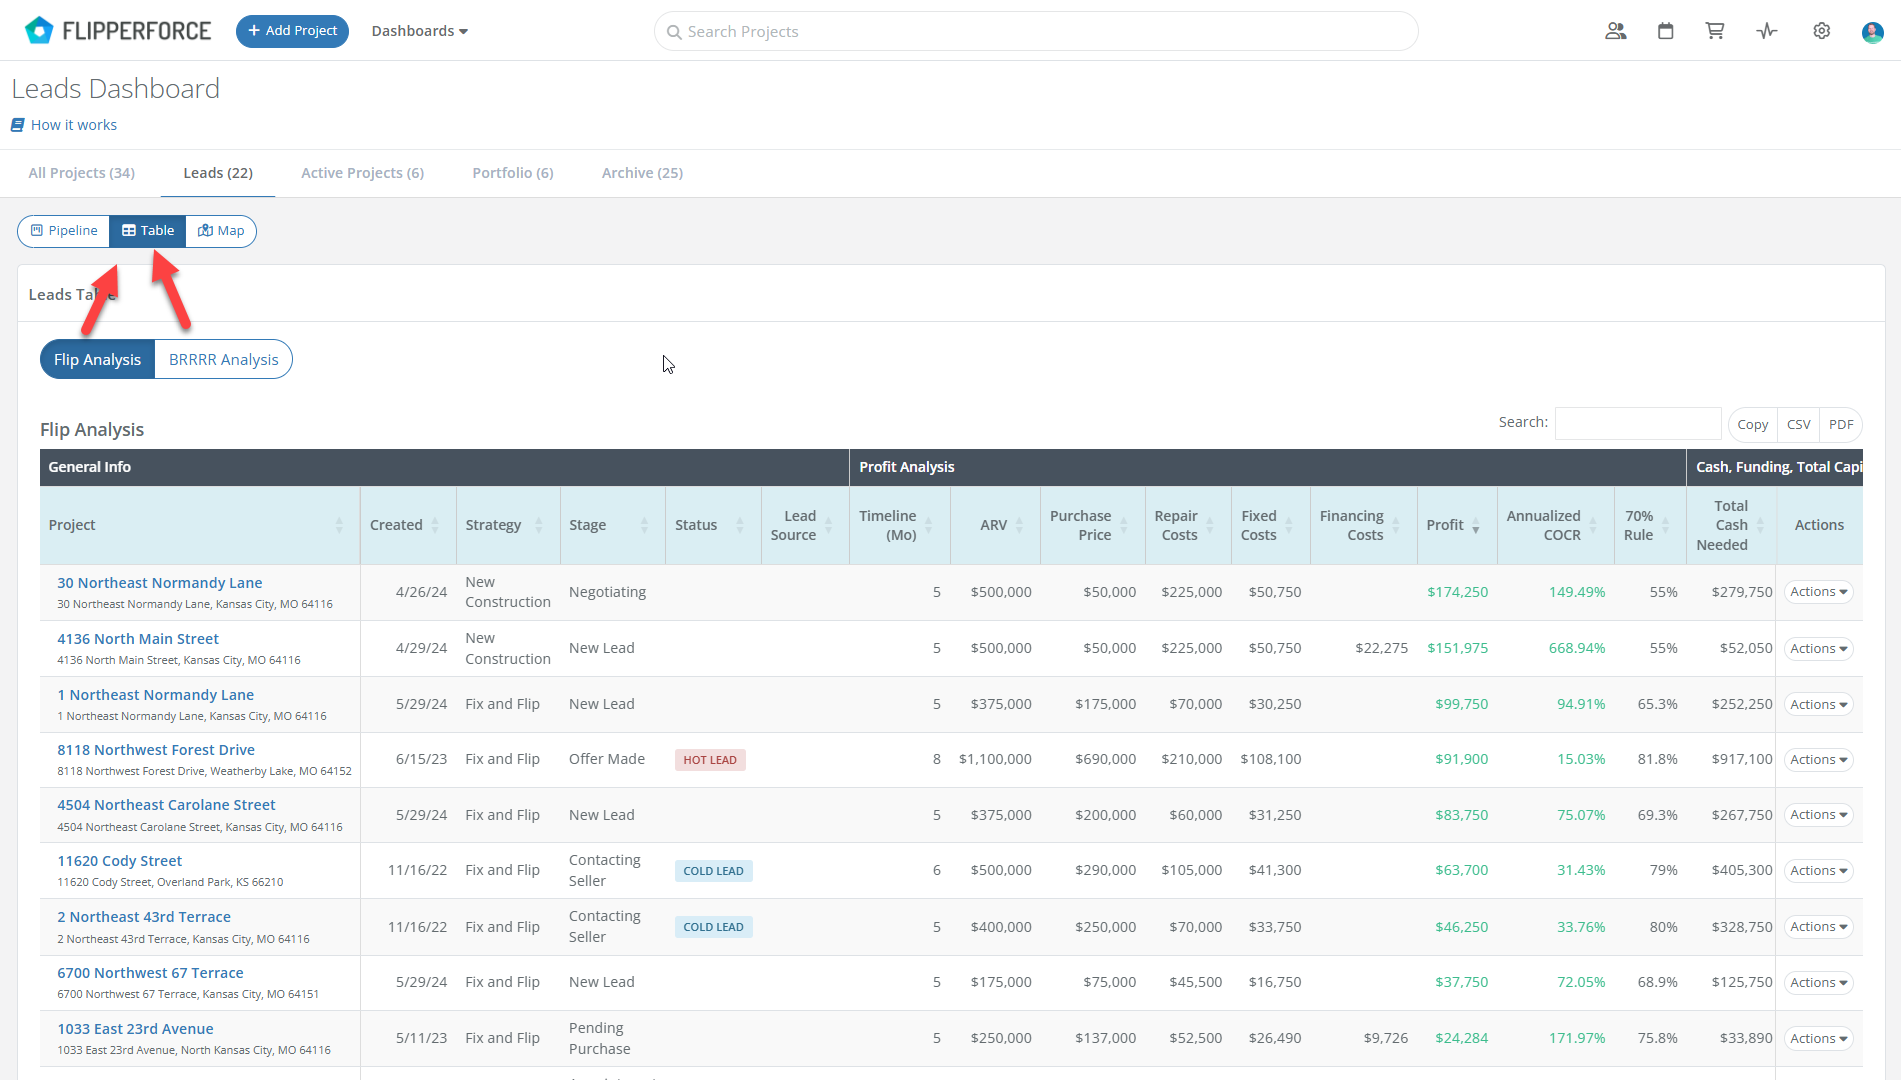
- Leads Dashboard: The Leads Dashboard Table view provides an overall view of the financial analysis for every Lead you have in your pipeline. The Lead Table view focuses on the financial datapoints like ARV, purchase price, renovation costs, and projected profit so you compare profitaiblity of your opportunities side-by-side. This table also shows how much Cash and Funding you will need for each deal so you can plan how much capital you need to raise for your deals.
- Active Projects Dashboard:The Active Projects Tablie view provides an overall view of all of project milestones, budget vs. actuals, and potential risks for your Active Projects. The table displays purchase date, construction start and completion targets, and your sales goals. Track spending with the "Spent to Date" column and identify variances from your budget.
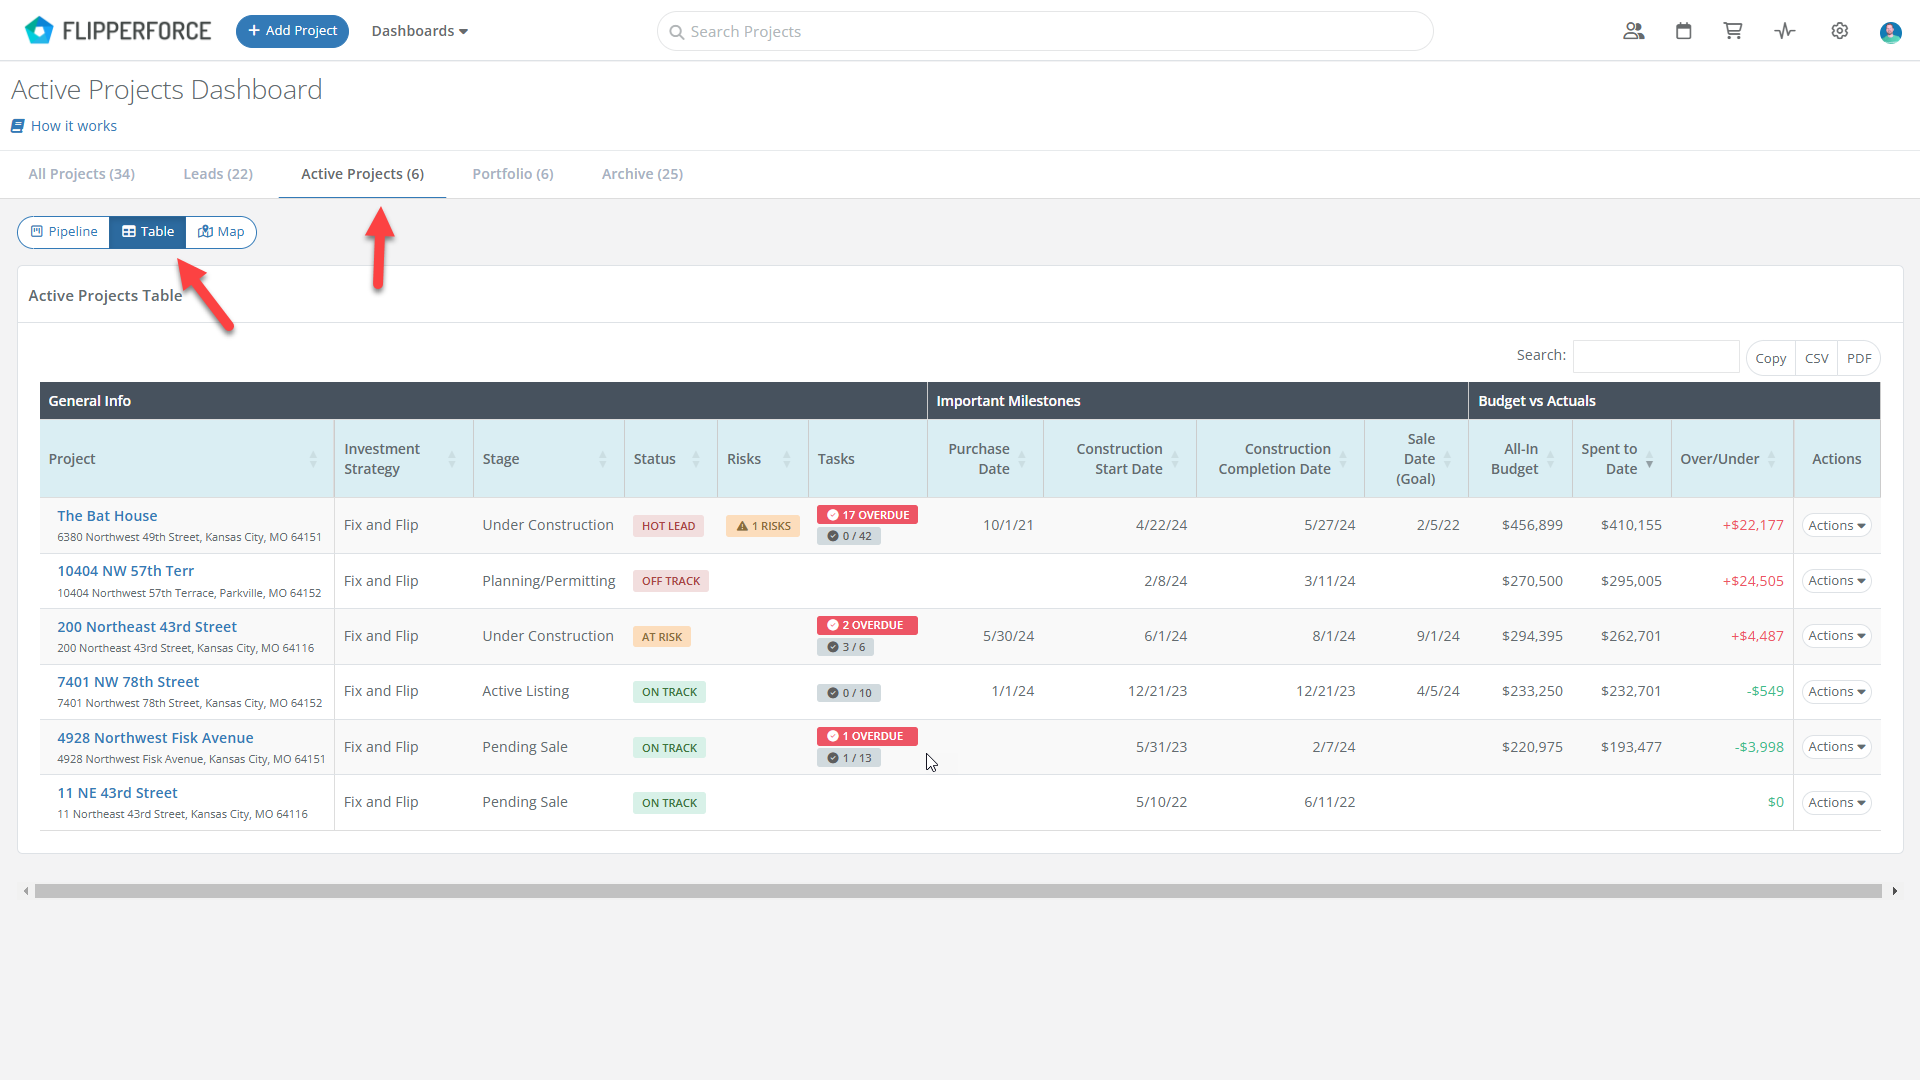
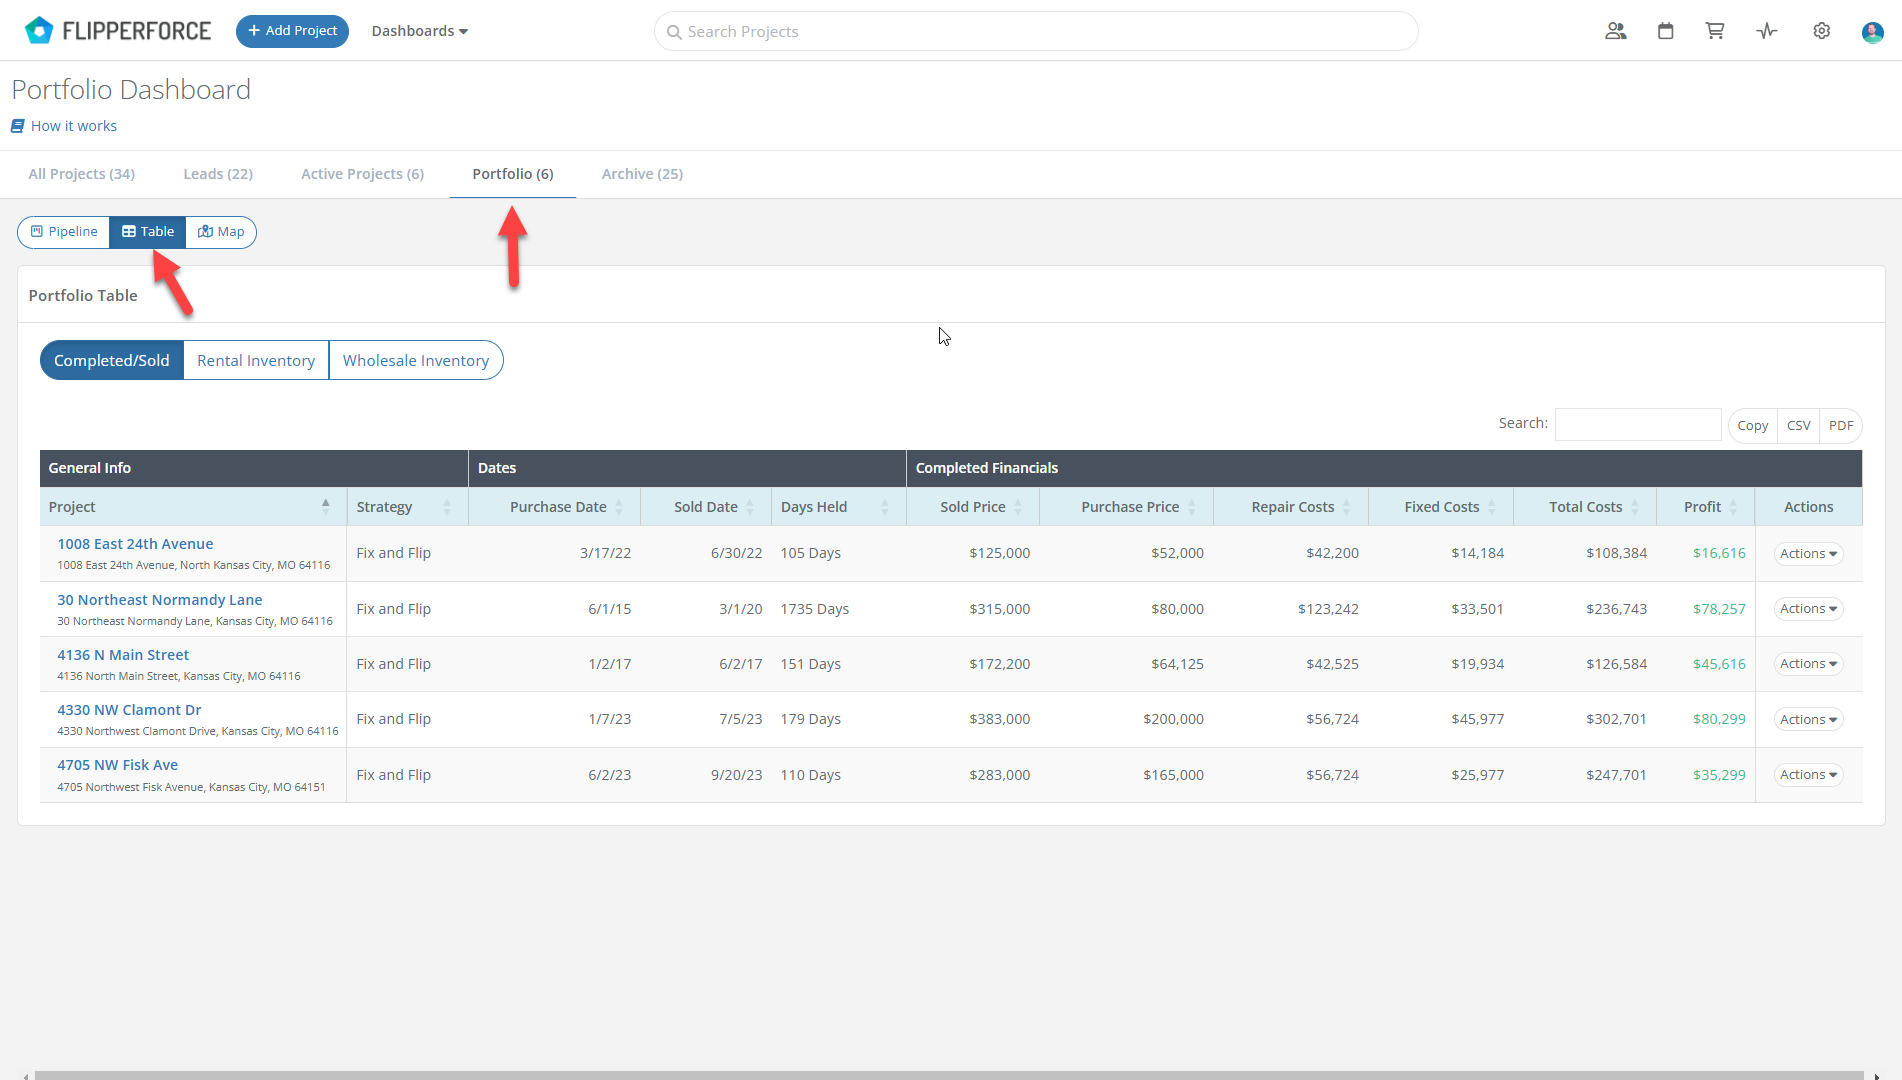
- Portfolio Dashboard:Analyze the performance of your Completed Projects with ease. See buy and sell dates alongside final financial results. The table showcases the final sale price, your renovation and holding costs, and calculates your total profit. We've even included dedicated tables for rental and wholesale holdings, providing valuable insights for your entire Portfolio.
