We're thrilled to announce the launch of major improvements to the Accounting Dashboard which brings you a more focused and informative way to visualize the financial health of your projects, from active renovations to completed flips and long-term rentals.
Consolidated Financial Overview in One Place
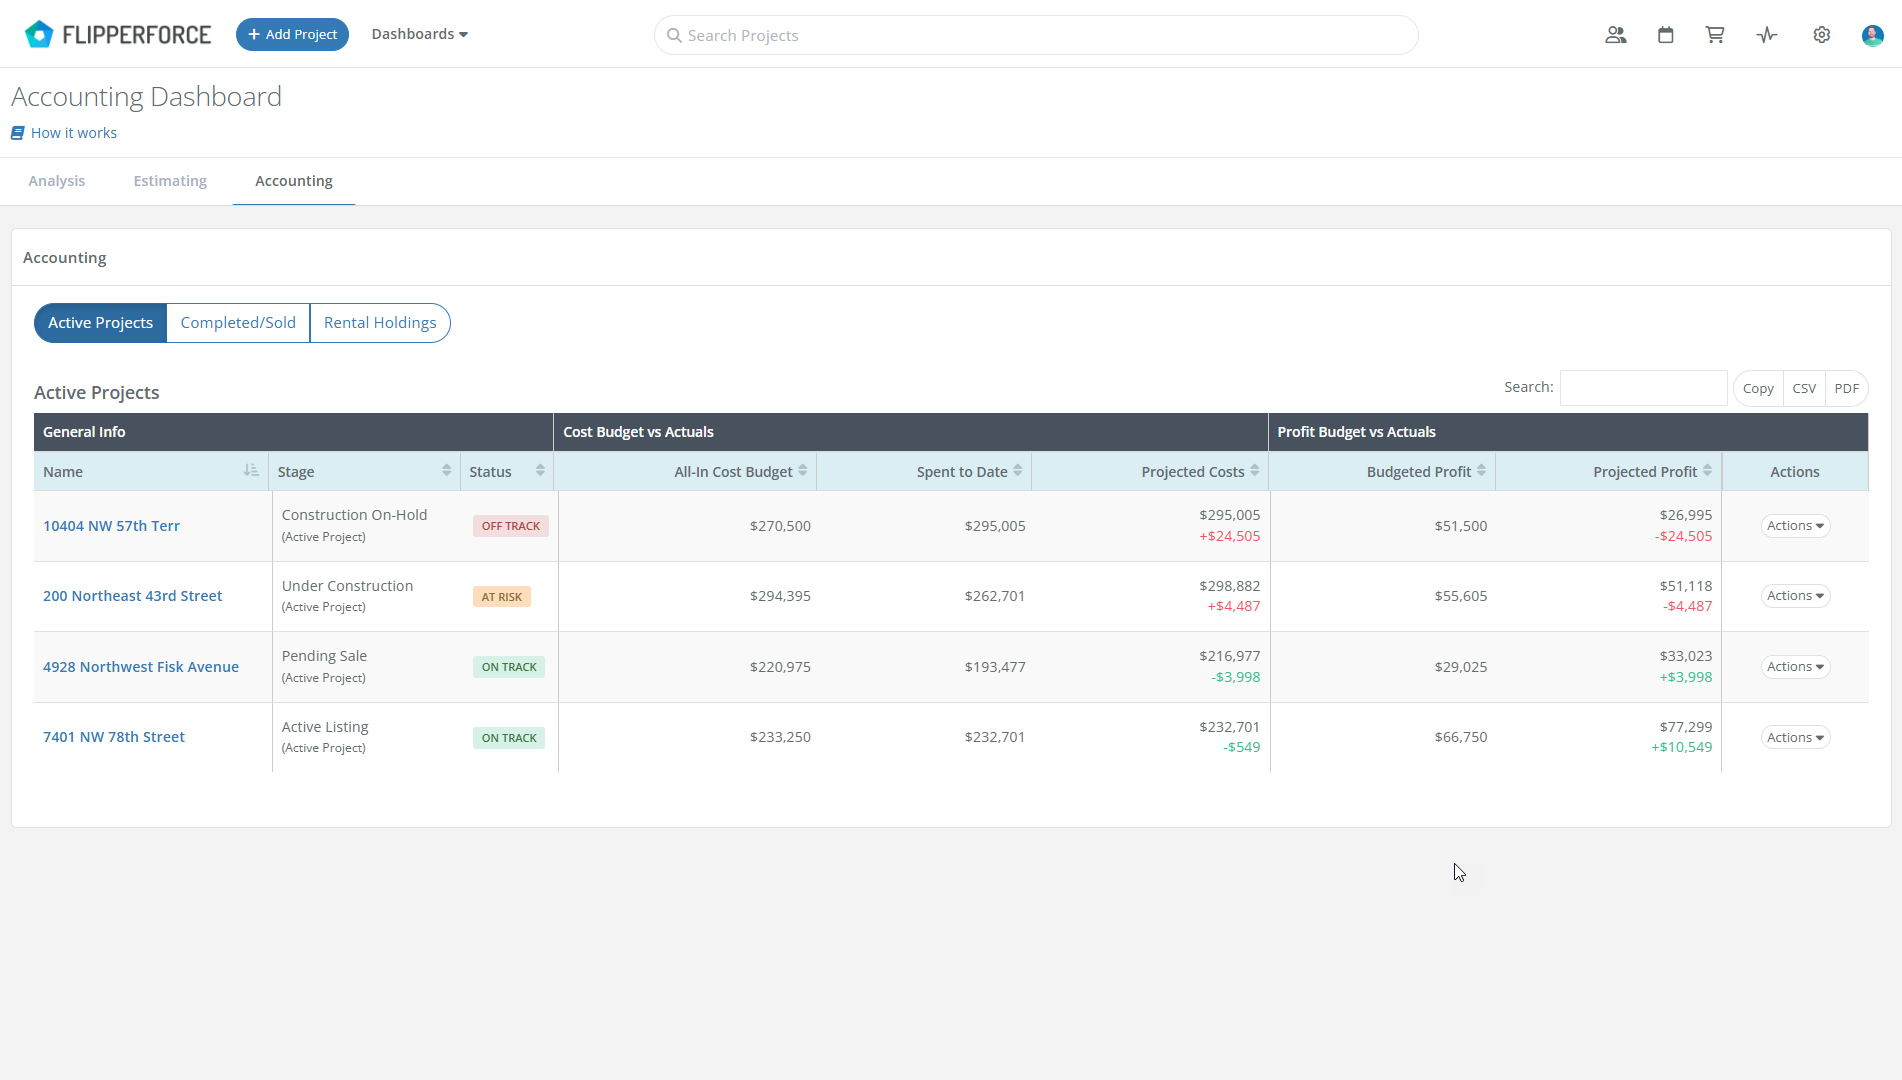
The redesigned Accounting Dashboard provides a consolidated view of your budgets and expenses across all your projects, whether they're actively under construction, successfully completed, or long-term rentals.
Active Projects Table
- Compare your budgeted costs with actual spending to identify potential overages and keep your projects on track.
- See the forecasted impact on your profit margin, allowing you to make informed budget adjustments.
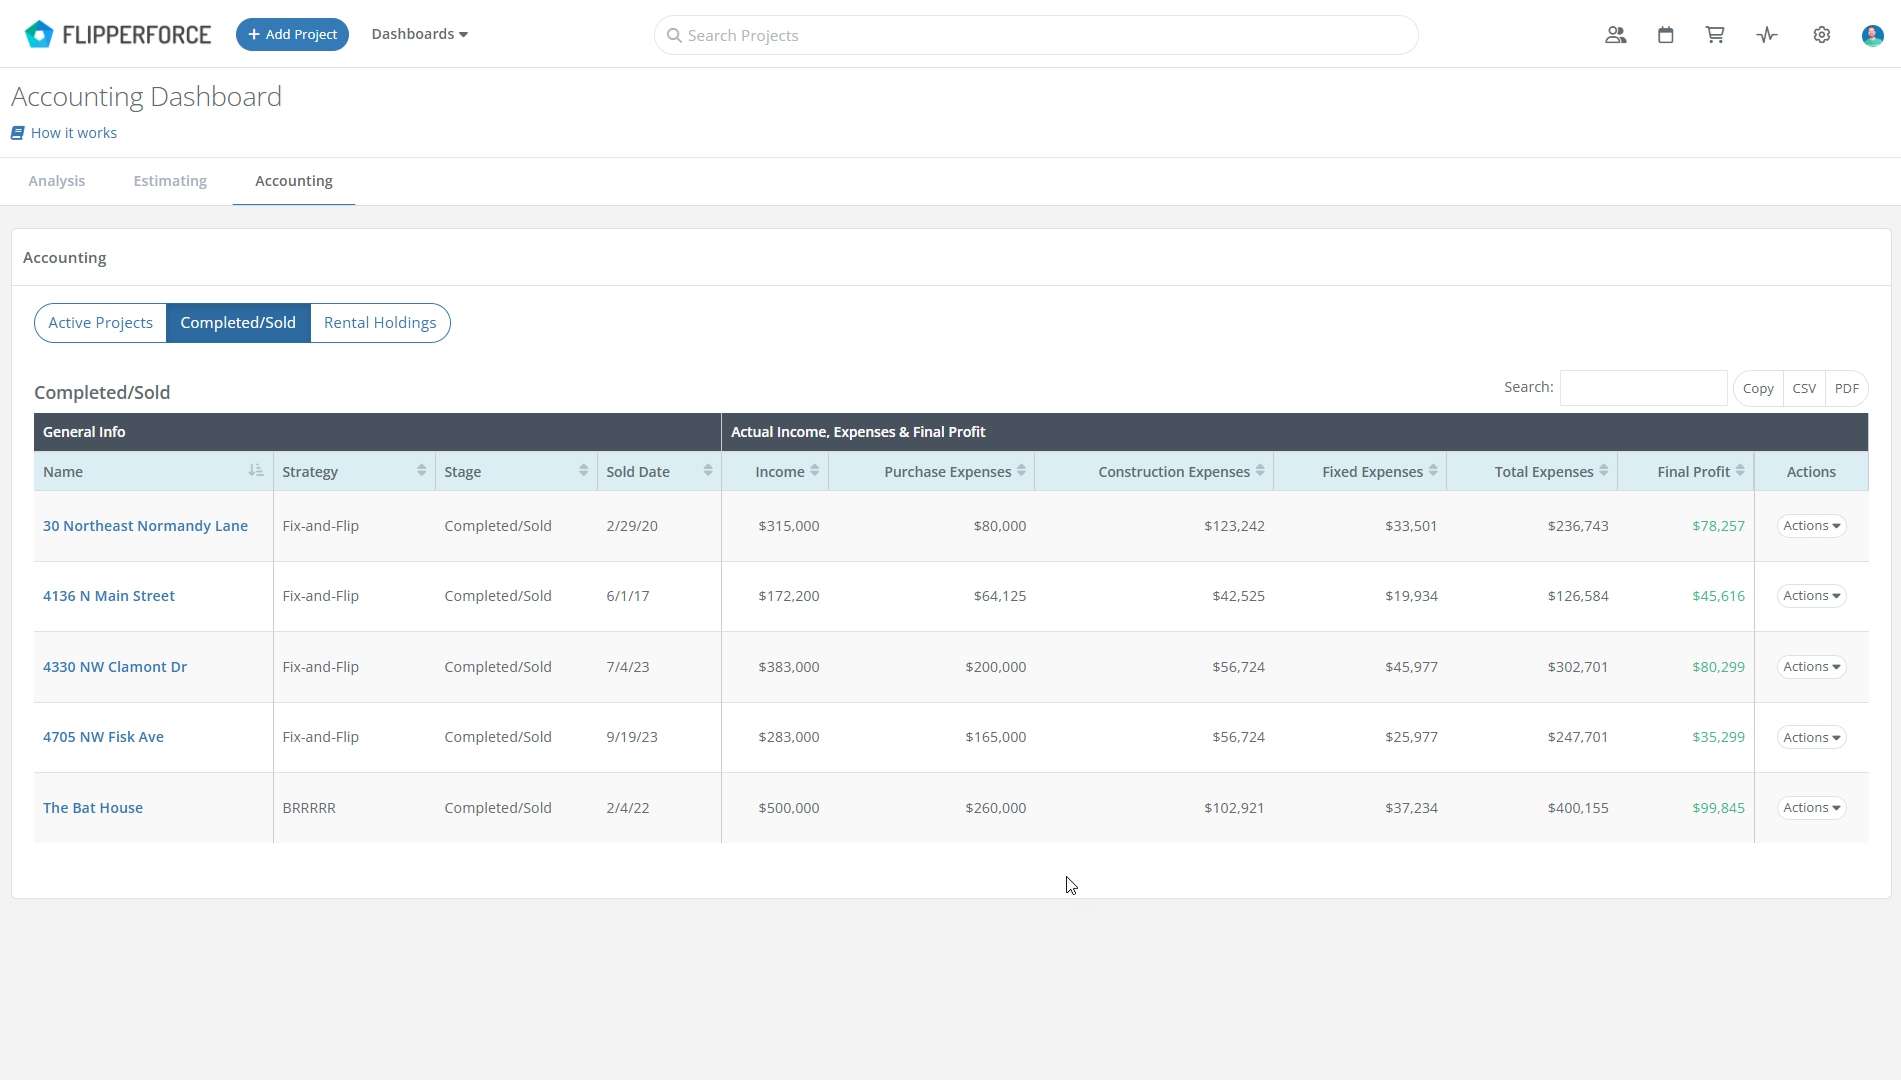
Completed/Sold Table
- Gain valuable insights into the final profitability of your completed projects.
- Easily access income, expenses, and final profit figures for tax purposes.
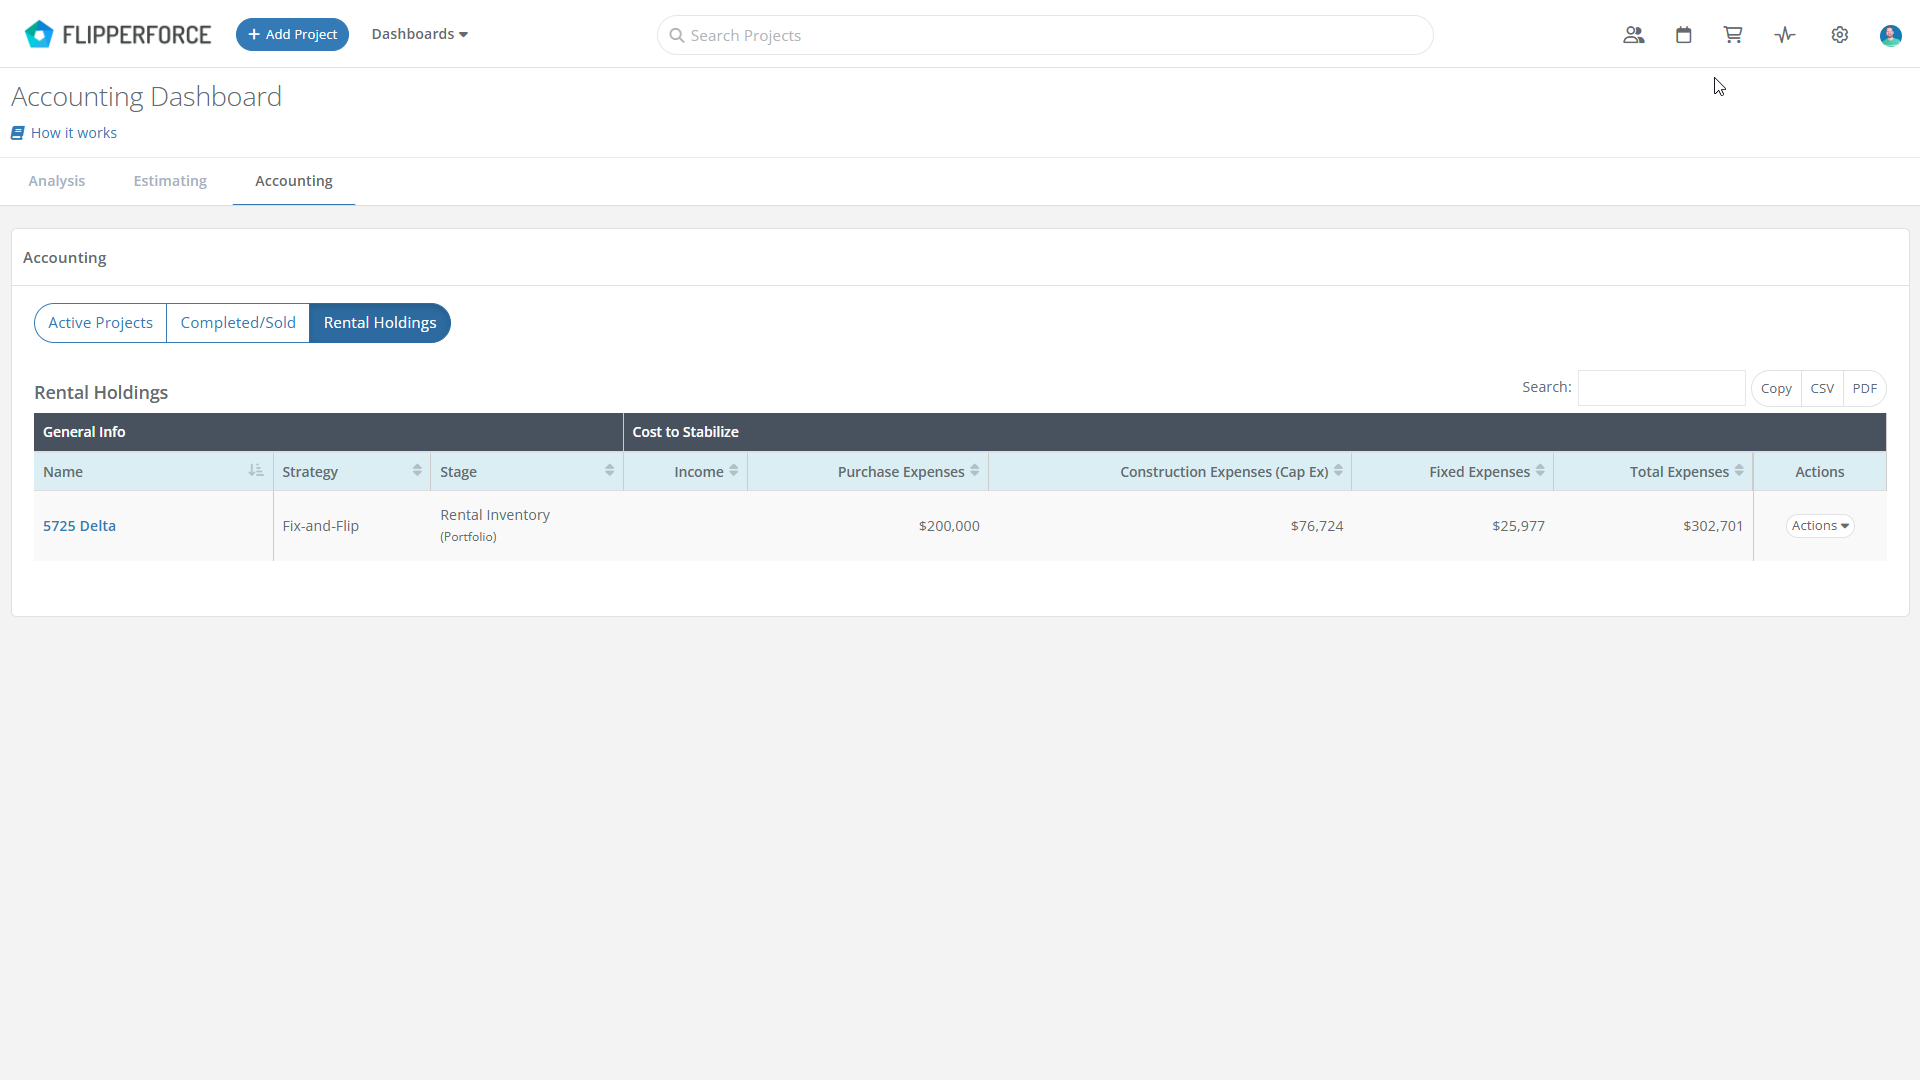
Rental Holdings Table
- Track the cost basis of your rental properties.
- Understand how much you've invested in getting them up and running.
Export for Further Analysis:
- Need the data in another format? No problem! Every table allows you to export information to a CSV spreadsheet or copy it to your clipboard.
- Run custom reports, filter data by specific criteria, or integrate it with your favorite financial software for deeper analysis.
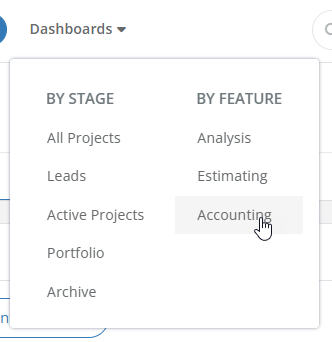
To access the Accounting Dashboard, navigate to the "Dashboards" dropdown menu in the top navigation bar, under "By Feature."