new
Flip Analyzer/BRRRR Analyzer
Analysis Dashboards Get a Powerful Upgrade
We're excited to announce some major improvements to your Analysis Dashboards! These updates provide a consolidated overview of your key deal analysis metrics, giving you a more powerful and insightful overview of all of your deals.
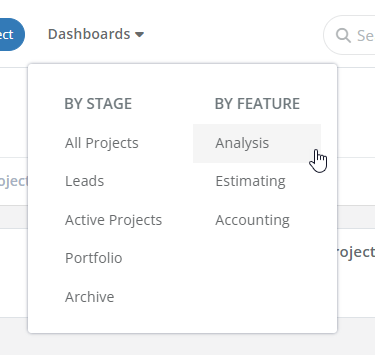
Access the revamped Analysis Dashboard from the "Dashboards" dropdown menu in the top navigation bar. It's now organized under the "By Feature" section.
Consolidated Deal Analysis in One Place
Our revamped Analysis Dashboard provides a central location to view all your crucial analysis data points in a single table. This means you can see high-level summaries of all your Flip Analyzer and BRRRR Analyzer projects side-by-side for effortless comparison.
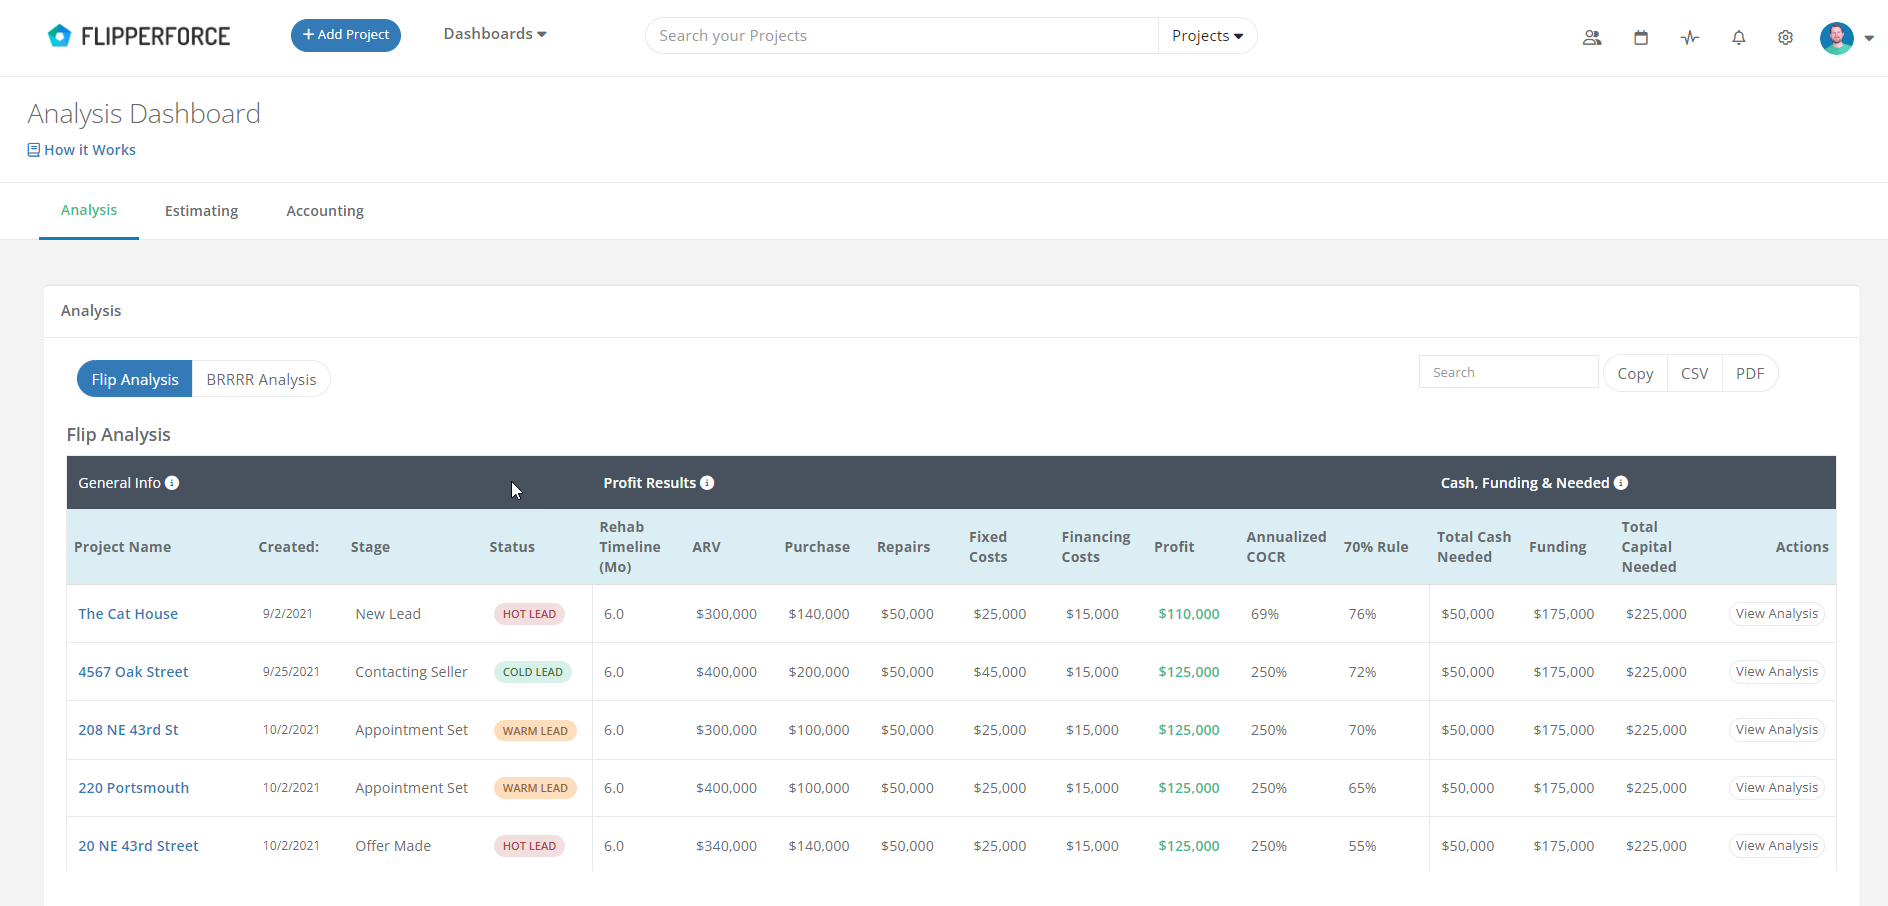
Flip Analysis Table
We've supercharged the Flip Analysis table with a bunch of new data points, including:
- Enhanced Profit View: See a clear picture of your project's profitability with all the high-level data points used to calculate profit, including ARV, purchase price, repair budget, fixed costs, financing costs, and calculated profit.
- Compare Profitability Side-by-Side: Analyze the overall profitability and Cash-on-Cash Return (COCR) of your deals in one location.
- The 70% Rule Gauge: Get a quick measure of how your deals stack up against the industry standard 70% rule. This allows you to identify buying opportunities and assess historical trends.
- 70% Rule Comparison - See how your deals stack up against this industry benchmark.
- Cash, Funding & Capital Needed: Understand how much cash you'll need to cover upfront costs and how much outside funding you may require. This is crucial for planning how much capital to have on hand, especially if you're considering multiple deals.
New BRRRR Analysis Table View
For our buy, rehab, rent, refinance, repeat (BRRRR) investors, we've introduced a brand new BRRRR Analysis table. This table mirrors the Flip Analysis table structure, but with a focus on metrics that matter to long-term rental investors, such as:
- Short-Term Equity: See the potential equity you can build by acquiring the property at a discount and renovating it.
- Long-Term Results: Analyze factors like monthly rental income, operating expenses, debt service, cash flow, and total return on investment.
- Stabilization & Refinance Cash Flow: Understand how much cash is needed to stabilize the property and the potential remaining cash after refinancing.
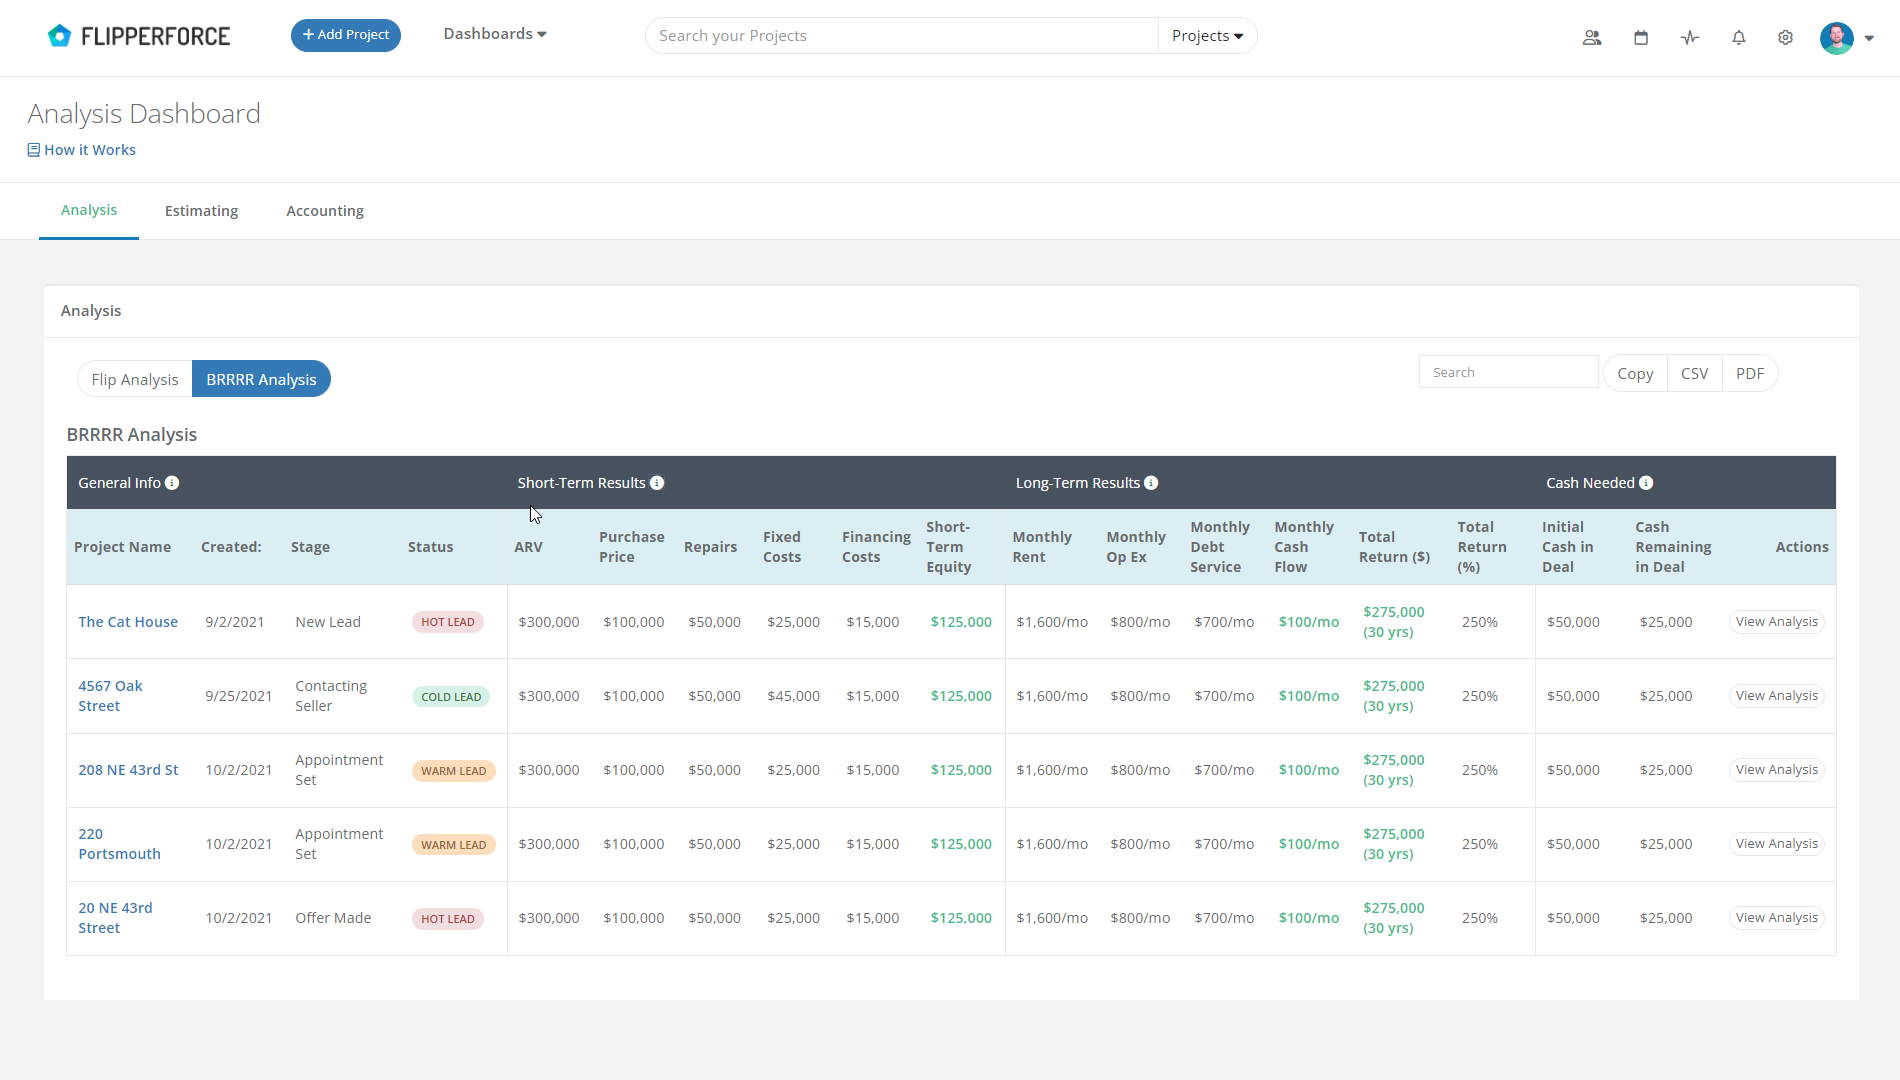
This high-level overview empowers you to compare potential long-term investments side-by-side and make data-driven decisions about your real estate portfolio.
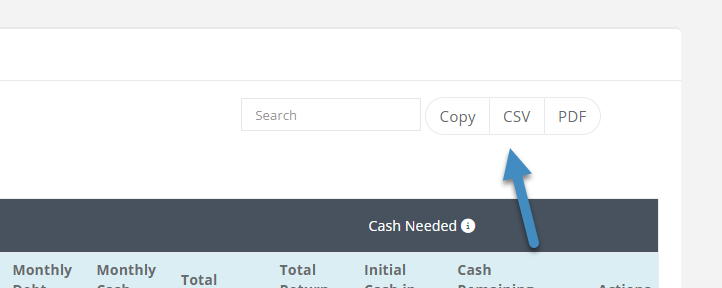
Export to CSV for Further Data
Need to run your own custom calculations? No problem! Our Analysis Dashboards now allow you to export your data to a CSV spreadsheet for seamless import into Excel or Google Sheets.
We're constantly striving to improve FlipperForce to better serve your needs. If there are any additional data points you'd love to see included in the Analysis Dashboards, please let us know!